How do I make a Pie chart in Figma?

If you have a lot of data points and you're probably looking for a way to make them more easy to read then you're probably thinking about making some cool Pie charts in Figma.
What an original idea. No, but really you can't go wrong with pies. Any pies - charts, apple, cream.
In this tutorial I'm going to teach you how to do it (the pie chart, not the cream pie). It's pretty simple:
How do I make a Pie chart in Figma?
First method - the manual one is you start with a circle and you duplicate it and resize until you get as many slices and sizes you want:
The second method is you use a free plugin to do it for you.
I recommend this method because it's definitely faster and you won't have to spend your whole life making sure your pie's proportions are correct to the actual values.
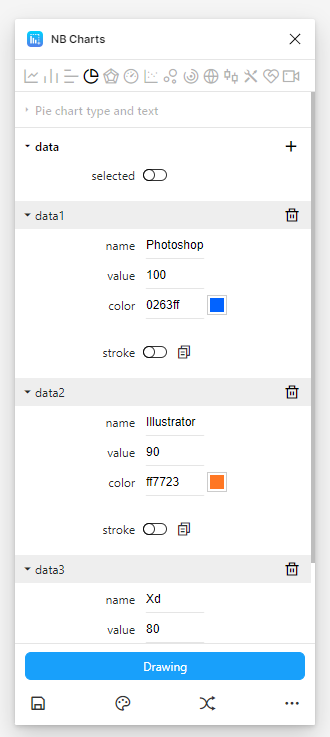
The plugin is called NB Charts and it has any type of chart you can think of.

You can even add values, colors, strokes, gradients, etc. It's all there!
Personally I'm using plugins for most of my design work because it saves me a lot of time and headaches. As long as they're free I don't really see any reason not to. Who's going to stop me? The Figma police? Wait wtf.

