Can I Make Charts in Canva?

Charts are incredibly useful tools that visually represent data in a clear and concise manner. They allow for easy interpretation of complex information, making them an essential component of presentations, reports, and data analysis.
Can I Make Charts in Canva?
Absolutely! Canva, a popular graphic design tool, has recently introduced a variety of charts that you can easily create, edit, and format to your specific needs. No need to be a design expert or have advanced technical skills - Canva makes chart creation simple and accessible for everyone.
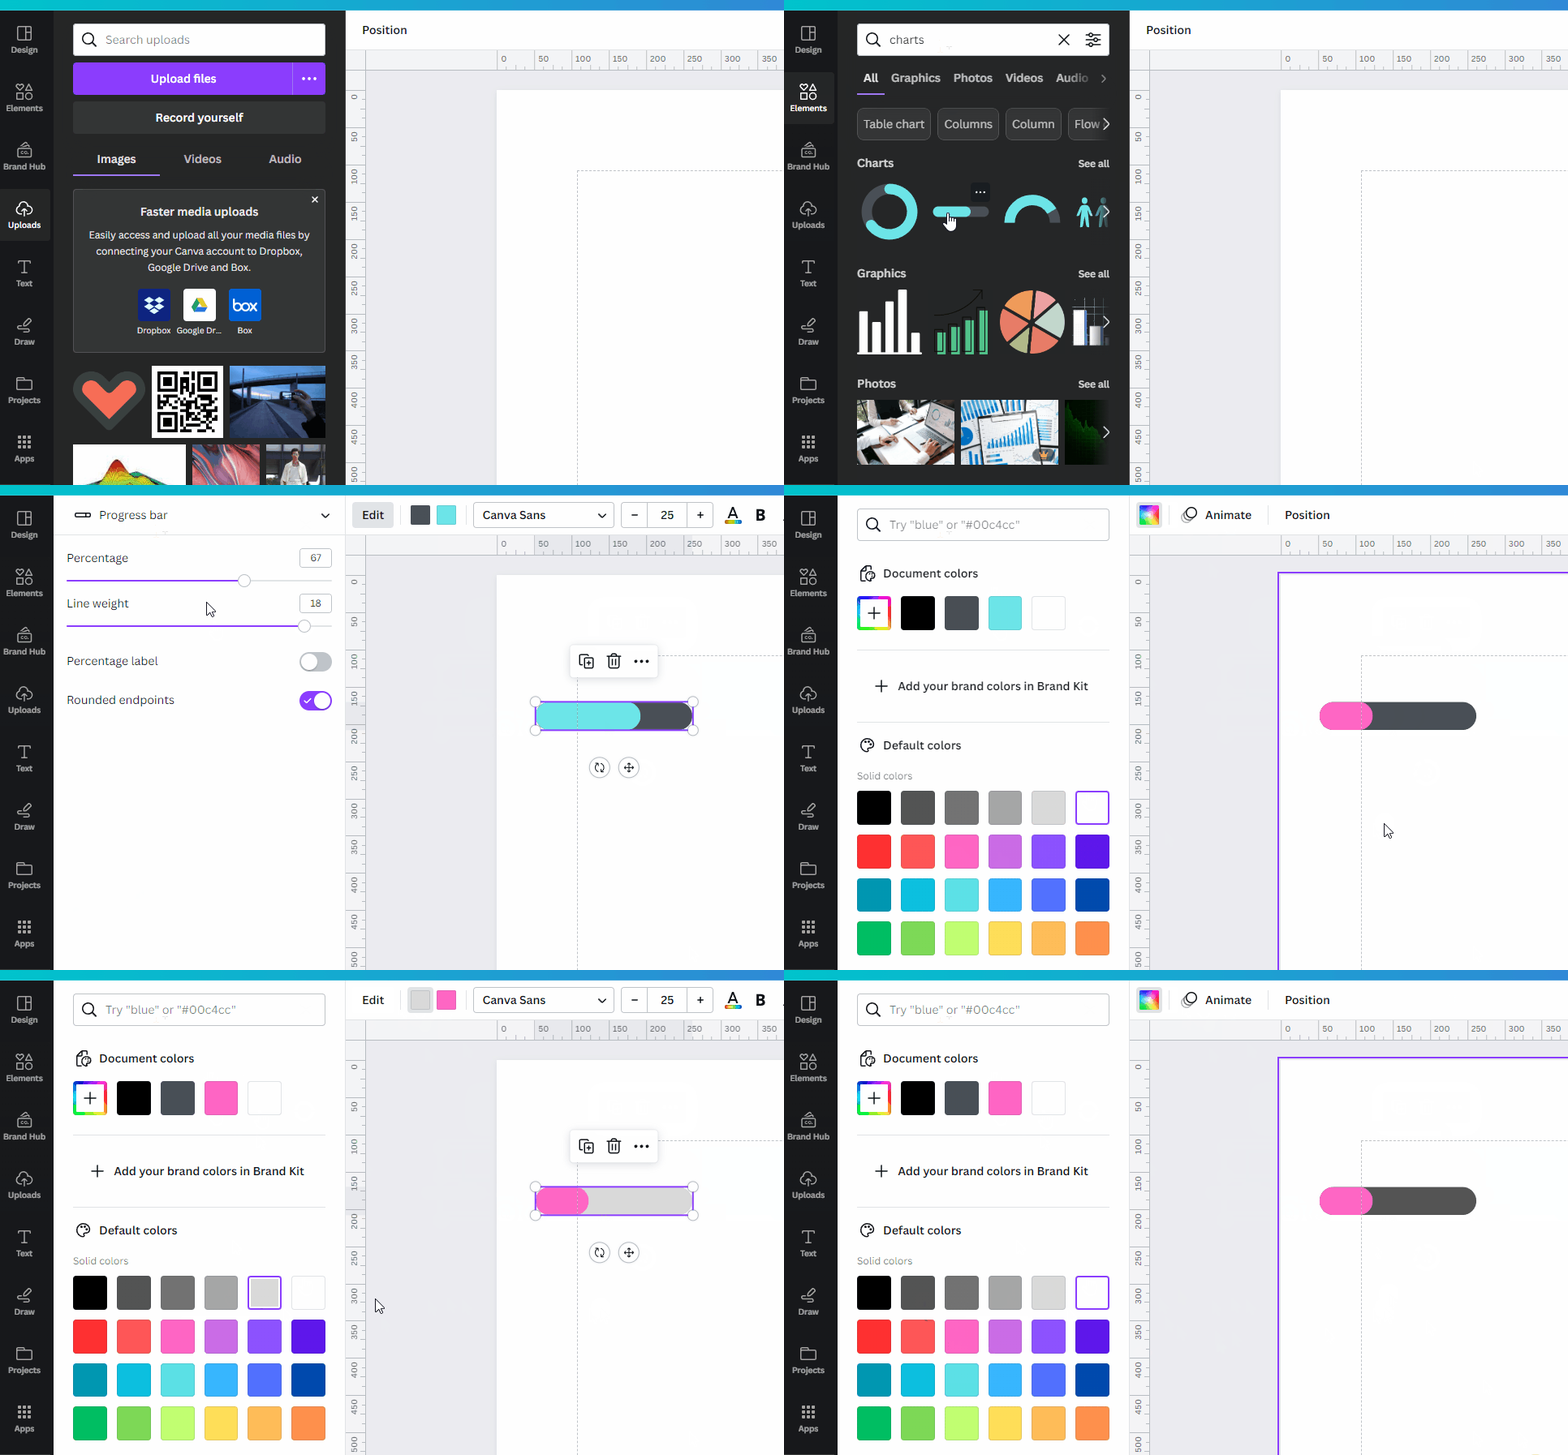
To make a chart in Canva, follow these easy steps:
Create a new design or open an existing one.
In the left-hand panel, click on "Elements."
In the search bar, type "Charts" and hit enter.
Browse through the different chart options available, including bar charts, line charts, pie charts, and more.
Click on the chart you want to use, and it will be added to your design.
You can now customize the chart by adjusting the data, colors, labels, and other formatting options.
Once you are satisfied with your chart, you can download it in various formats, such as PNG, JPG, PDF, or even as an animated GIF.

Conclusion
In conclusion, Canva makes it easy and convenient for users to create charts for their presentations, reports, and data analysis needs. With its wide range of chart options and intuitive design tools, you can create professional-looking charts without any design expertise.
