
Can I Create a Graph in Canva?

What are graphs?
Graphs are visual representations of data that allow us to easily understand and analyze information. They come in various types, such as pie charts, bar charts, line graphs, and more. Graphs help simplify complex data sets and make patterns and trends more accessible.
Can I Create a Graph in Canva?
Canva offers a user-friendly platform that allows you to create various types of graphs to visually represent your data. The process is simple and intuitive:
- Open Canva and log in to your account.
- Start a new project or open an existing one where you want to add a graph.
- Click on the "Elements" tab in the left sidebar.
- Use the search bar to look for a specific type of graph you want to add, such as a pie chart or a bar chart.
- Select the graph element you prefer and drag it onto your design canvas.
- Once the graph is added, you can easily customize it to match your data:
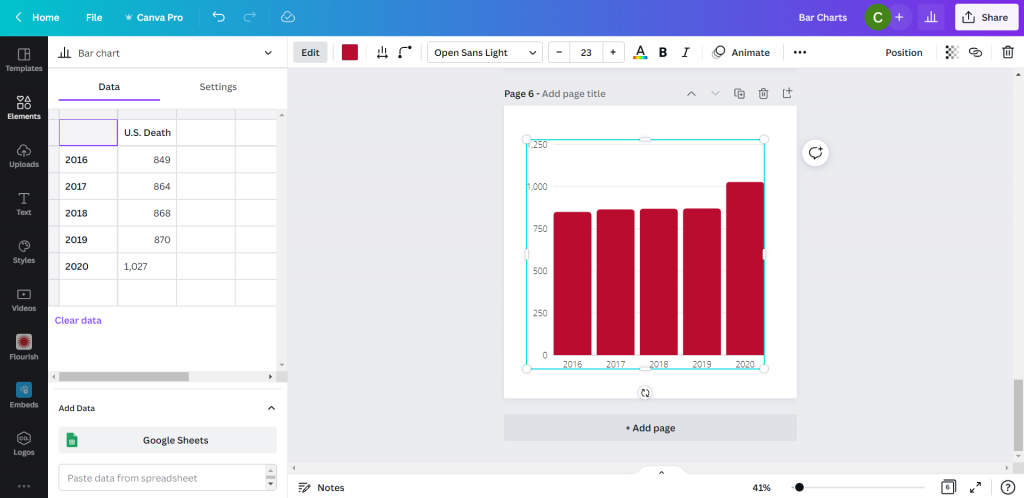
For example, if you chose a bar chart:
- Click on the chart to access the data editor.
- Add your values and data points to the editor. Canva provides a user-friendly interface where you can input your data.
- As you add the values, the graph will automatically update to reflect the changes.
- Customize the colors, labels, and other aspects of the graph to make it visually appealing and easy to understand.
By following these simple steps, you can create a graph that effectively communicates your data in a visually engaging manner. Canva's intuitive interface eliminates the need for complex design skills, making it accessible to users with varying levels of design experience.
Conclusion
Creating graphs in Canva is a straightforward process that empowers you to visualize your data without the need for specialized software or design expertise.
With a wide range of graph types to choose from and easy customization options, you can transform your data into meaningful visuals that effectively convey your message.
